
How Many People Live in Tokyo? The Answer Depends on the Map
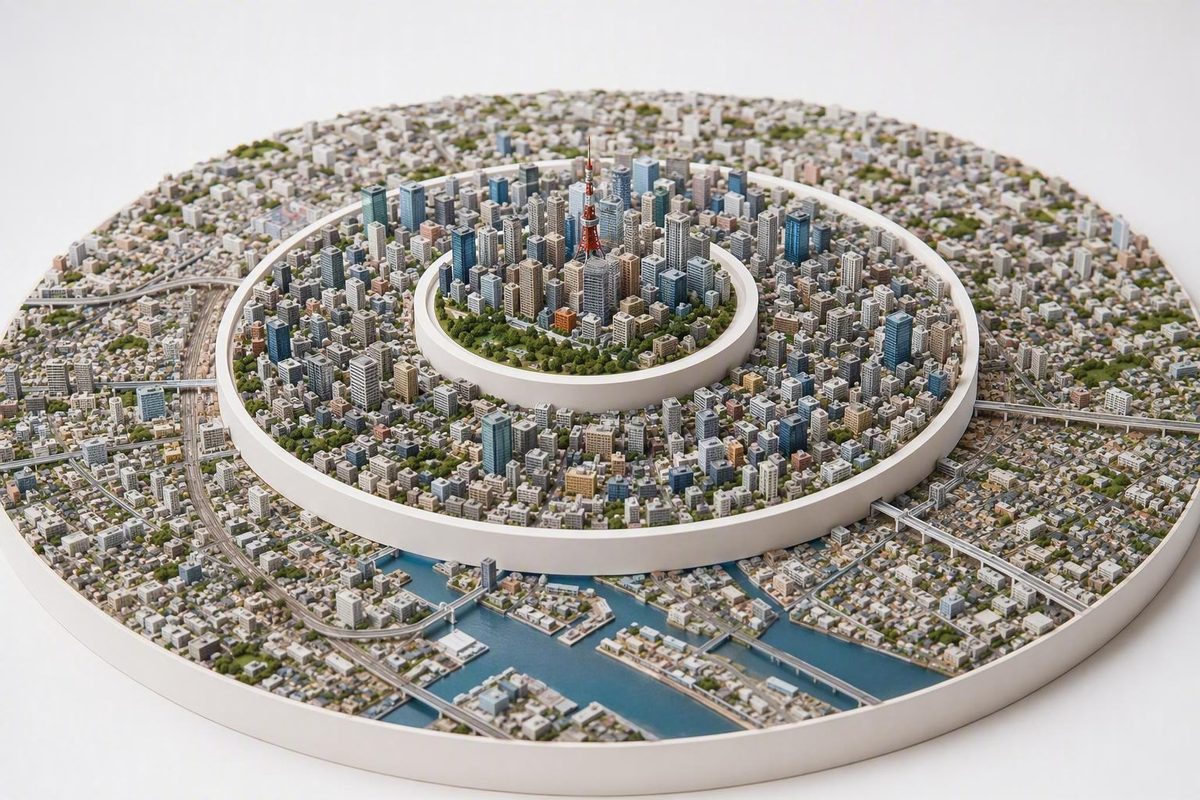
Tokyo-to has 14.27 million residents, versus 9.95 million in the 23 wards and 33.4 million in the UN-defined urban agglomeration.
Data checked September 5, 2026. This article uses the Tokyo Metropolitan Government’s October 1, 2025 population count as its latest verified annual administrative benchmark. It uses Japan’s Statistics Bureau for national figures and UN-linked 2025 estimates for international urban comparisons.
Tokyo’s population at a glance
Tokyo Metropolis had approximately 14.27 million residents on October 1, 2025, according to the Tokyo Metropolitan Government’s population overview. This is the clearest answer when “Tokyo” means Tokyo-to, the prefecture-level territory governed by the Tokyo Metropolitan Government.
It is not the population of every city and suburb commonly grouped into Greater Tokyo. The 23 special wards, the full metropolis and the wider continuously developed urban area are separate geographies.
All figures below are rounded. The dates and boundaries matter as much as the totals.
| Geographic unit | Population | Reference date | Included territory | Best use |
|---|---|---|---|---|
| 23 special wards | About 9.95 million | October 1, 2025 | Tokyo’s eastern urban core, including Shinjuku, Shibuya, Minato, Setagaya and the other special wards | Discussing central Tokyo or the area associated with the former City of Tokyo |
| Tokyo Metropolis (Tokyo-to) | About 14.27 million | October 1, 2025 | The 23 special wards, the Tama area in western Tokyo and Tokyo’s outlying islands | Administrative statistics and comparisons with Japan’s prefectures |
| UN-defined Tokyo urban agglomeration | 33.4 million | 2025 | Tokyo’s continuously developed urban area and surrounding suburbs across administrative borders | International comparisons of large urban areas |
Sources: Tokyo Metropolitan Government for the wards and Tokyo-to figures; the UN-linked 2025 summary from Nippon.com for the urban-agglomeration estimate.
The internal distribution of Tokyo-to explains the difference between the first two totals. In October 2025, approximately 9.95 million people lived in the 23 special wards, 4.30 million in Tama and 22,000 on the islands. Together, they produced the metropolitan total of about 14.27 million (Tokyo Metropolitan Government, cited above).
The much larger 33.4 million figure follows an urban-agglomeration concept rather than Tokyo’s administrative border. It counts the connected city and its suburbs, including developed areas outside Tokyo-to (Nippon.com’s UN-linked 2025 summary, cited above).
These totals are not contradictory. They count different territories:
- Use 14.27 million for Tokyo as a Japanese administrative jurisdiction.
- Use 9.95 million for the 23 special wards.
- Use 33.4 million for the UN-defined urban agglomeration in standardized global comparisons.
What counts as Tokyo?
Tokyo is administratively unusual. Although commonly described as a city, Tokyo Metropolis functions more like one of Japan’s prefectures than a conventional municipality. The historical City of Tokyo no longer exists as a single municipal government corresponding to the entire modern metropolis; Tokyo-to instead contains the special wards and other municipalities, as summarized in an overview of Tokyo’s administrative structure.
The three most useful definitions are:
- The 23 special wards: the densely populated urban core many visitors picture when they hear “Tokyo.”
- Tokyo Metropolis: the full prefecture-level jurisdiction, including the wards, western municipalities and islands.
- The urban agglomeration: the connected built-up city and suburbs extending beyond Tokyo-to.
The 23 special wards
The wards include internationally familiar places such as Shinjuku, Shibuya, Chiyoda, Minato and Taitō. They form Tokyo’s historical urban core, but they do not constitute all of Tokyo Metropolis.
Each special ward has its own local government. Collectively, the wards contained about 9.95 million residents on October 1, 2025 (Tokyo Metropolitan Government benchmark cited above).
Tokyo Metropolis
Tokyo Metropolis includes the 23 special wards and the Tama area to their west. Tama contains cities, towns and villages that are administratively part of Tokyo even though many have their own centers and identities. The metropolis also extends into the Pacific through its outlying islands.
That is why Tokyo-to’s population is substantially larger than the ward total. Its approximately 14.27 million residents included about 4.30 million people in Tama and roughly 22,000 island residents, in addition to the 9.95 million people in the wards (Tokyo Metropolitan Government benchmark cited above).
Tokyo-to is normally the appropriate boundary for prefectural administration, metropolitan policy and comparisons with Kanagawa, Osaka or Japan’s other prefectures. The recommendation concerns statistical consistency: those comparisons should use equivalent administrative units.
The Tokyo urban agglomeration
An urban agglomeration follows the extent of a connected urban settlement rather than stopping at a political boundary. Under the UN definition summarized by Nippon.com, it consists of a major city and its suburbs without requiring the outer edge to follow local-government borders.
The Tokyo urban agglomeration had 33.4 million residents in a contiguous built-up area that included the 23 special wards, Yokohama, Kawasaki, Saitama, Chiba, and most of the surrounding Kanagawa, Saitama, and Chiba prefectures 10 Biggest Cities In Japan. A geographic account of the 2025 Tokyo agglomeration describes how those neighboring municipalities are incorporated into the larger total.
This is not the same as simply adding every resident of four prefectures. Another widely used regional definition combines Tokyo, Saitama, Chiba and Kanagawa into a capital region. That region is straightforward to describe through prefectural boundaries, but it does not necessarily match a contiguous built-up area. One follows administrative borders; the other follows an urban-settlement methodology.
As a rule:
- Use Tokyo Metropolis for Japanese administrative and prefectural questions.
- Use the 23 special wards when the subject is central Tokyo.
- Use the UN urban agglomeration for international comparisons among large urban settlements.
- Use Greater Tokyo only after defining its included territory.
Suggested graphic: Three layers of Tokyo
Show the 23 special wards as the urban-core layer. Add the rest of Tokyo Metropolis—primarily Tama to the west, with the islands in an inset—as the second layer. Then show the surrounding urban agglomeration extending into Kanagawa, Saitama and Chiba. Because the islands are geographically separate and the agglomeration follows settlement rather than prefectural borders, present the layers as nested or overlapping concepts rather than perfect concentric circles.
Tokyo’s share of Japan’s population
Japan had an official population of 123.802 million on October 1, 2024. That was 550,000 fewer people than a year earlier, a decline of 0.44% and the country’s fourteenth consecutive annual decrease. Tokyo-to was Japan’s most populous prefecture and held 11.5% of the national population, according to the Statistics Bureau of Japan’s 2024 population estimates.
In plain language, about one in nine people in Japan lived in Tokyo-to in 2024.
That share should not be recalculated by dividing Tokyo’s October 2025 population by Japan’s October 2024 population. The figures have different reference dates and would not produce an exact same-date comparison. The official 11.5% figure is the appropriate measure for 2024 (Statistics Bureau of Japan, cited above).
A broader claim—that around 30% of Japan’s population lives in the capital region—uses a much larger boundary. The Tokyo Metropolitan Government applies that approximation to a region comprising Tokyo plus Saitama, Chiba and Kanagawa. It is useful for describing national population concentration, but it remains sensitive to the boundary and reference date.
The two statements answer different questions:
- About one in nine: the share living inside Tokyo-to in the official 2024 estimate.
- Roughly three in ten: the approximate share living across the four-prefecture capital region.
Tokyo’s national importance is also evident beyond its own border. Japan’s five most populous prefectures in 2024—Tokyo, Kanagawa, Osaka, Aichi and Saitama—together held 37.9% of the national population (Statistics Bureau of Japan, cited above).
The distinction is essential. “Tokyo held 11.5% of Japan’s population” is an administrative statement. “The Tokyo region held around 30%” is a broader regional approximation. Neither should silently replace the other.
Why Tokyo can grow while Japan shrinks
Tokyo’s recent growth does not mean Japan’s demographic contraction has ended. It means population change is geographically uneven.
In the official 2024 prefectural estimate, only Tokyo-to and Saitama-ken recorded population increases among Japan’s 47 prefectures, and Tokyo had the highest rate of increase. The other 45 prefectures declined while the country lost 550,000 residents overall (Statistics Bureau of Japan).
Tokyo continues to attract residents from other prefectures, concentrating people and activity in the capital even as many other places lose population. A third-party statistical overview reports that Tokyo recorded an approximately 58,490 net population gain in 2023, while also describing continued migration from elsewhere in Japan (Statista’s Tokyo overview).
That number needs two qualifications. It applies specifically to 2023, and it comes from a commercial statistical aggregator. It is not a complete, same-period decomposition of Tokyo’s current population change.
The key distinction is between aggregate change and natural change:
- Aggregate population change includes births, deaths and migration.
- Natural change is births minus deaths.
- Migration may include moves within Japan and movement across Japan’s international border.
The evidence supports saying that migration contributes to Tokyo’s relative resilience. It does not support saying that Tokyo grows because births exceed deaths. It also does not permit an exact current allocation of growth among domestic migration, international migration and natural change.
This produces a pattern that can initially appear paradoxical. National aging, low fertility and rural depopulation can coexist with population concentration in Tokyo. People and economic activity can move toward the capital while the country’s total population falls. Tokyo is an exception within the broader national pattern, not evidence against it.
“Tokyo is growing” also needs geographic qualification. Trends are not uniform across the metropolis. Available evidence supports differences in population levels, density and direction of change: some municipalities outside the wards have experienced decline, while the islands’ population has continued to fall. Growth in one part of Tokyo-to can outweigh losses elsewhere.
The most accurate summary is therefore cautious: recent migration has helped Tokyo-to grow or remain comparatively resilient, while Japan’s national population continues to decline and some places within Tokyo also lose residents.
Population and density inside Tokyo
A total of 14.27 million can make Tokyo sound like one uninterrupted expanse of equally intense urban development. It is not. The metropolitan average combines very dense wards with suburban cities, mountain areas and lightly populated islands.
| Area within Tokyo-to | Approximate population | Approximate area | Population density |
|---|---|---|---|
| 23 special wards | 9.95 million | 628 km² | 15,853 people/km² |
| Tama | 4.30 million | 1,160 km² | 3,710 people/km² |
| Islands | 22,000 | 413 km² | Not directly comparable with the continuous mainland city |
Source: Tokyo Metropolitan Government figures for October 1, 2025; area figures are rounded.
The 23 wards accommodated well over twice Tama’s population on a little more than half its land area. Tama remained highly populated in aggregate, but its density—about 3,710 people per square kilometer—was less than one-quarter of the wards’ 15,853 people per square kilometer. The islands covered about 413 square kilometers but had only around 22,000 residents, and their population was continuing to fall (Tokyo Metropolitan Government, cited above).
These are residential population densities. They do not directly measure station usage, tourist crowds or how busy a particular street will feel. A business district can have intense daytime activity without an equally large residential population, while a heavily residential ward may feel quiet in a particular place or at a particular hour.
For travelers, the practical lesson is to understand Tokyo as a collection of areas linked by transport, not as one uniformly dense place. Shinjuku, Ueno, western residential districts and island communities all belong to Tokyo, but they produce very different experiences and travel times.
Practical travel note
Tokyo Bureau’s travel guidance recommends planning days by area and navigating a large station through the line, platform, level, exit and landmark relevant to the immediate journey. Its large-station navigation guide advises travelers to solve the part of the station they need rather than trying to master the entire complex. This is first-party travel advice, not a source for population statistics.
The same principle works at city scale. A visitor does not need to mentally process 14 million residents or a 33-million-person agglomeration to plan a day. The useful questions are which district to visit, which transport connection serves it and which station exit is closest to the destination.
How Tokyo became a 14-million-person metropolis
Tokyo’s demographic history is better understood as a series of phases than as a line of uninterrupted growth. The figures below form a source-based history of Edo and modern Tokyo, but they are not a perfectly boundary-consistent statistical series. In particular, the 1721 figure refers to historical Edo, whose boundaries were not those of present-day Tokyo Metropolis.
- 1721: Edo had approximately 1.3 million residents, showing that it was already a major population center.
- 1935: Tokyo’s population reached 6.36 million.
- October 1945: The total had fallen to 3.49 million, marking a major wartime interruption in the longer trend.
- 1962: Tokyo passed 10 million residents.
- 1997: In-migration exceeded out-migration for the first time in 12 years.
- 2000: Tokyo passed 12 million.
- 2009: It passed 13 million.
- 2019: It passed 14 million.
- October 2025: Tokyo Metropolis stood at approximately 14.27 million.
Source: Tokyo Metropolitan Government historical and population account, cited above. The Edo figure is a historical-city estimate; the modern milestones concern Tokyo’s metropolitan population as presented by the source.
The fall between 1935 and 1945 prevents any simple account of uninterrupted expansion. The later thresholds also show that growth occurred at changing speeds: Tokyo took decades to move from 10 million to 12 million, then passed the next two million thresholds over a shorter period.
The 1997 migration milestone is useful because it marks renewed net attraction after 12 years in which out-migration had been higher. It helps explain Tokyo’s return to growth after a flatter period without implying that births, deaths and every form of migration moved in the same direction.
Care is required when comparing this timeline with charts showing 30 million or more residents. Those larger totals describe Greater Tokyo or an urban agglomeration. Substituting them into a Tokyo-to timeline would change the geographic unit midway through the comparison.
The durable conclusion is not merely that Tokyo grew. Edo and Tokyo have constituted a major population center for centuries, but the long-term history includes changing boundaries, a profound interruption and distinct phases of renewed expansion.
Is Tokyo still the world’s largest city?
Not under the UN’s 2025 urban-agglomeration methodology. On that basis, Tokyo ranked third with 33.4 million residents, behind Jakarta at 41.9 million and Dhaka at 36.6 million.
The ranking uses urban agglomerations: major cities together with their suburbs, without requiring the boundary to follow local-government lines. This supports more consistent international comparisons than many “city proper” totals, because municipal structures differ substantially among countries. It remains one methodology rather than the only possible definition of a city.
| Urban agglomeration | 2025 population | Global rank |
|---|---|---|
| Tokyo | 33.4 million | 3rd |
| Osaka | 13.0 million | 25th |
| Nagoya | 7.1 million | 49th |
Source: Nippon.com’s summary of the UN’s World Urbanization Prospects 2025.
Tokyo ranked first in the cited 2005 report, when its urban agglomeration was estimated at 31.4 million. Its changed position should not be treated as proof of a sudden population collapse. It reflects the current standardized comparison, growth in other agglomerations and the methodology used in the 2025 assessment (Nippon.com, cited above).
This helps explain why older descriptions of Tokyo as “the world’s largest city” remain common. Some were accurate for a particular dataset and year. Others use a wider metropolitan or commuting-region boundary instead of the UN’s current urban-agglomeration measure.
Four terms are especially easy to confuse:
- City proper: the population within a municipality’s legal border.
- Metropolis: in Tokyo’s case, the prefecture-level Tokyo-to administration.
- Metropolitan area: often a wider labor-market or commuting region, with definitions that vary by source.
- Urban agglomeration: a developed city and suburban area measured under a specified settlement methodology.
A ranking that compares one place’s municipality with another place’s metropolitan region is not like-for-like. Wider Tokyo estimates may describe valid geographies, but they should not be presented as definitive without a precise boundary, date and method.
The responsible answer is therefore: Tokyo was not first in the UN’s 2025 urban-agglomeration ranking; it was third. A different result is possible only under a different, clearly stated geographic definition.
Tokyo’s population outlook to 2050
Observed counts and projections answer different questions. Tokyo Metropolis’s 14.27 million and the urban agglomeration’s 33.4 million are 2025 benchmarks. A 2050 number is a model-based projection rather than a count.
The UN-linked projection estimates that Tokyo’s urban agglomeration may decline from 33.4 million in 2025 to 30.7 million in 2050. Under the same projection, Tokyo would rank seventh among the world’s urban agglomerations in 2050, according to a summary of the UN-linked outlook.
Neither outcome is settled. Population projections depend on assumptions about future fertility, mortality and migration. Rankings also depend on the trajectories of every other urban area in the comparison.
The projected decline is consistent with Japan’s broader demographic context. The national population is already shrinking, and people aged 65 or older represented 29.3% of Japan’s population in the official 2024 estimate (Statistics Bureau of Japan, cited above). These national trends do not necessarily affect every part of Tokyo at the same rate.
Migration has recently supported Tokyo’s relative resilience, but the available evidence does not establish that migration can indefinitely offset natural decrease. It also does not provide separate long-range projections for the wards, Tama and islands.
Policy responses illustrate the concern about population concentration. Under specified conditions, participating families were offered ¥1 million per child to move out of metropolitan Tokyo, with recipients required to remain outside Tokyo for at least five years or repay the state, according to the Royal Geographical Society’s account of the relocation incentive. This describes a policy offer, not evidence that the incentive successfully reduced concentration.
Any future Tokyo figure will retain the same boundary problem as today’s totals. A projected decline in the UN urban agglomeration does not automatically establish the future course of Tokyo-to, the 23 wards or every municipality in the capital region.
The clearest present-day summary remains:
- 23 special wards: about 9.95 million residents in October 2025.
- Tokyo Metropolis: about 14.27 million residents on October 1, 2025.
- UN-defined urban agglomeration: 33.4 million residents in 2025.
Sources: Tokyo Metropolitan Government for the first two figures; UN-linked 2025 estimates summarized by Nippon.com for the third.
In national context, Tokyo-to held 11.5% of Japan’s population in the official 2024 estimate, even as the country’s total population continued to shrink (Statistics Bureau of Japan, cited above). The useful question is not simply “How many people live in Tokyo?” It is which Tokyo, on what date, and for what kind of comparison?
Frequently asked questions
What was the population of Tokyo in 2025?
Tokyo Metropolis had approximately 14.27 million residents on October 1, 2025. If “Tokyo” means the central 23 special wards, the answer was about 9.95 million. The broader UN-defined urban agglomeration had 33.4 million in 2025 (Tokyo Metropolitan Government and UN-linked sources cited above).
Why do some sources say Tokyo has 14 million people while others say 33 million?
They measure different territories. The roughly 14 million figure covers Tokyo Metropolis—the wards, Tama and the islands. The 33.4 million figure covers the UN-defined urban agglomeration, which extends across administrative borders into surrounding built-up areas. Both are valid when their boundaries and dates are clearly labeled (Tokyo Metropolitan Government and Nippon.com, cited above).
How many people live in Tokyo’s 23 special wards?
Approximately 9.95 million people lived in the 23 special wards on October 1, 2025. The wards form Tokyo’s dense urban core but are only one part of Tokyo Metropolis (Tokyo Metropolitan Government, cited above).
What percentage of Japan’s population lives in Tokyo?
Tokyo-to accounted for 11.5% of Japan’s population in the official October 1, 2024 estimate—about one person in nine. A broader region comprising Tokyo, Saitama, Chiba and Kanagawa contains around 30%, but that is a different, boundary-sensitive measure (Statistics Bureau of Japan and Tokyo Metropolitan Government, cited above).
Is Tokyo still the largest city in the world?
Not under the UN’s 2025 urban-agglomeration methodology. Tokyo ranked third with 33.4 million residents, behind Jakarta at 41.9 million and Dhaka at 36.6 million. Claims that Tokyo ranks first generally use an older comparison or a different metropolitan boundary (Nippon.com’s UN-linked summary, cited above).